 ADevGuide
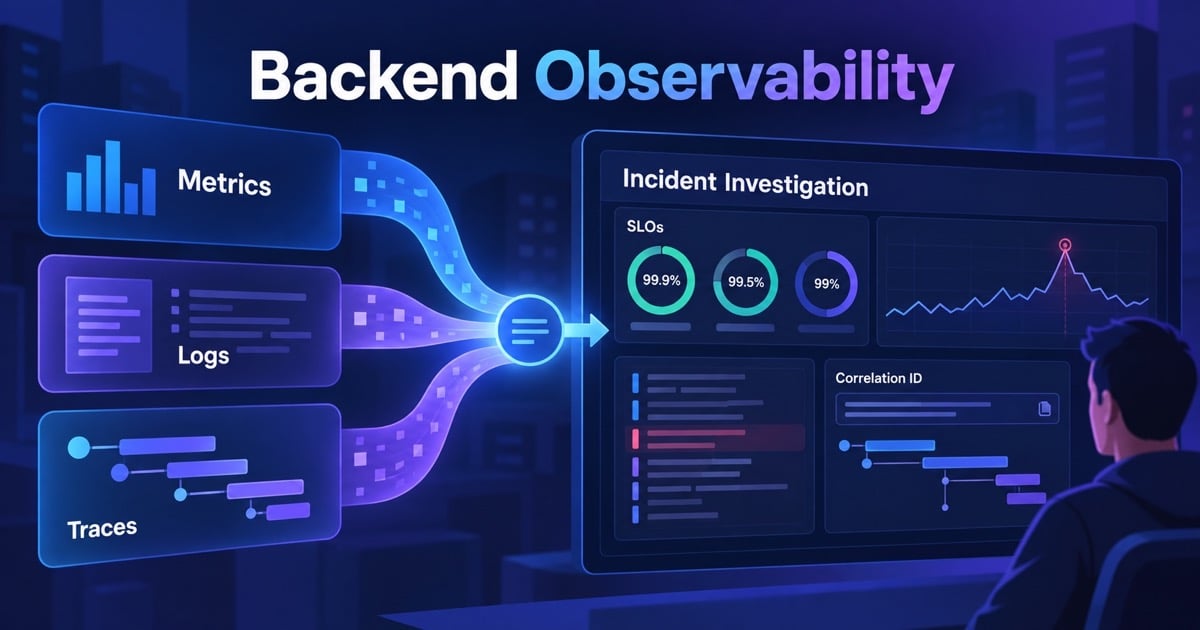
“The API is slow” is not a diagnosis. Is the time in the load balancer, a thread pool, a database lock, or a downstream call? Backend observability connects metrics, logs, and traces so engineers can explain an unknown failure from the system’s emitted evidence.
This guide covers the three signals, correlation, SLO-driven alerts, cardinality, and a practical incident workflow. Continue from APM, distributed tracing, and the Backend Interview Mastery series.
Table of Contents
Open Table of Contents
Monitoring vs Observability
Monitoring asks whether known conditions are healthy: error rate above 2%, queue age above five minutes, or disk below a threshold. Observability asks whether the system exposes enough context to investigate an unexpected question. Monitoring is an output and alerting practice; observability is the design of telemetry into the software.
The Three Signals
flowchart TD
    A[Request] --> B[Metrics]
    A --> C[Structured logs]
    A --> D[Distributed trace]
    B --> E[Alert and dashboard]
    C --> F[Detailed event context]
    D --> G[Cross-service latency path]
    E --> H[Incident investigation]
    F --> H
G --> H- Metrics are numeric time series for rates, errors, duration, saturation, queue age, and resource use. Histograms preserve latency distributions; averages hide tails.
- Logs are timestamped events with structured fields such as request ID, user-safe entity ID, error class, and deployment version. They explain why a particular operation failed.
- Traces connect spans across services and show where a request spent time. They are especially valuable when one user request crosses queues, databases, and external APIs.
No signal is sufficient alone. A trace can show a slow database span, metrics show that the problem affects 40% of traffic, and logs reveal a new query plan or tenant causing the skew.
Correlation and Context
Propagate a trace context and stable request or business correlation ID across HTTP, gRPC, message headers, scheduled jobs, and database logs where safe. A background worker should link its processing span to the producer’s event context rather than creating an unrelated root trace.
Keep secrets, tokens, raw payment data, and unnecessary personal data out of telemetry. Sample high-volume traces without dropping all errors and tail latency. Use stable dimensions such as route template and status class, not raw URLs or user IDs as metric labels.
SLOs and Useful Alerts
Start with a service-level objective: 99.9% successful checkout requests under 500 ms, or 99% of queue items completed within two minutes. Derive an error budget and alert on burn rate, not every small fluctuation. Alert on symptoms that require action: user-visible errors, freshness, saturation, and recovery time.
The RED method (rate, errors, duration) fits request services; USE (utilization, saturation, errors) fits infrastructure. Queue consumers need ingress rate, consume rate, oldest age, retry rate, and partition or queue skew. A dashboard is useful only when it helps a responder choose the next diagnostic step.
Cardinality and Cost
Every unique metric label creates a time series. A label containing user_id, full URL, or exception message can create millions of series and make the telemetry system itself expensive or unavailable. Put high-cardinality values in logs or trace attributes, and bound metric dimensions to route, status, region, and service.
Define retention by purpose: short, high-resolution metrics for alerting; longer low-resolution aggregates for trends; sampled traces for investigations; and controlled log retention for audits. Redaction, access control, encryption, and deletion policies apply to telemetry just as they do to product data.
Incident Workflow
- Confirm the user-facing symptom and affected SLO.
- Use metrics to bound start time, scope, and saturation.
- Trace a failing and a healthy request to locate the latency or error boundary.
- Filter structured logs by trace ID, deployment, dependency, and error class.
- Form a hypothesis, test it with a narrow metric or safe query, and mitigate first.
- Preserve evidence, write the timeline, and add telemetry that would shorten the next investigation.
Interview Questions
1. What is observability?
Observability is the ability to infer internal system state from emitted telemetry. It depends on instrumentation, context, and useful dimensions, not only on collecting more logs. Metrics, logs, and traces answer different parts of the investigation.
2. When would you use a histogram instead of an average?
Use a histogram for latency or size distributions where tail behavior affects users. An average can remain normal while P99 latency violates the SLO. Histograms support percentile and bucket-based alerting without retaining every request as a separate metric.
3. Why are trace IDs propagated through messages?
The work often completes after the original HTTP request returns. Propagating trace context connects producer, broker, and consumer spans, allowing operators to follow end-to-end age and failures. The context must be sanitized and sampled according to the telemetry policy.
4. What causes high-cardinality problems?
Using unbounded values such as user IDs, request IDs, or raw error messages as metric labels creates a series for every value. The metrics backend consumes memory, storage, and query capacity. Keep bounded dimensions in metrics and move detail to logs or traces.
5. How do you alert without creating noise?
Alert on SLO burn, user-visible symptoms, or saturation that needs intervention. Include enough context to choose an action and use warning dashboards for exploratory signals. Test alerts during failure drills and retire alerts that do not change behavior.
Conclusion
Observability is a product feature for operators: instrument the questions an incident will ask, correlate context across boundaries, and alert on SLO impact. Metrics show scope, logs show detail, and traces show the path. Good cardinality, privacy, sampling, and retention policies keep that evidence usable at scale.
References
- OpenTelemetry: Signals
- Google SRE Book: Monitoring distributed systems
- Prometheus: Histograms and summaries
YouTube Videos
- “OpenTelemetry Explained for Beginners - Traces, Metrics & Logs” - The Devops Duo [https://www.youtube.com/watch?v=Qg4aPDZFbkA]