 ADevGuide
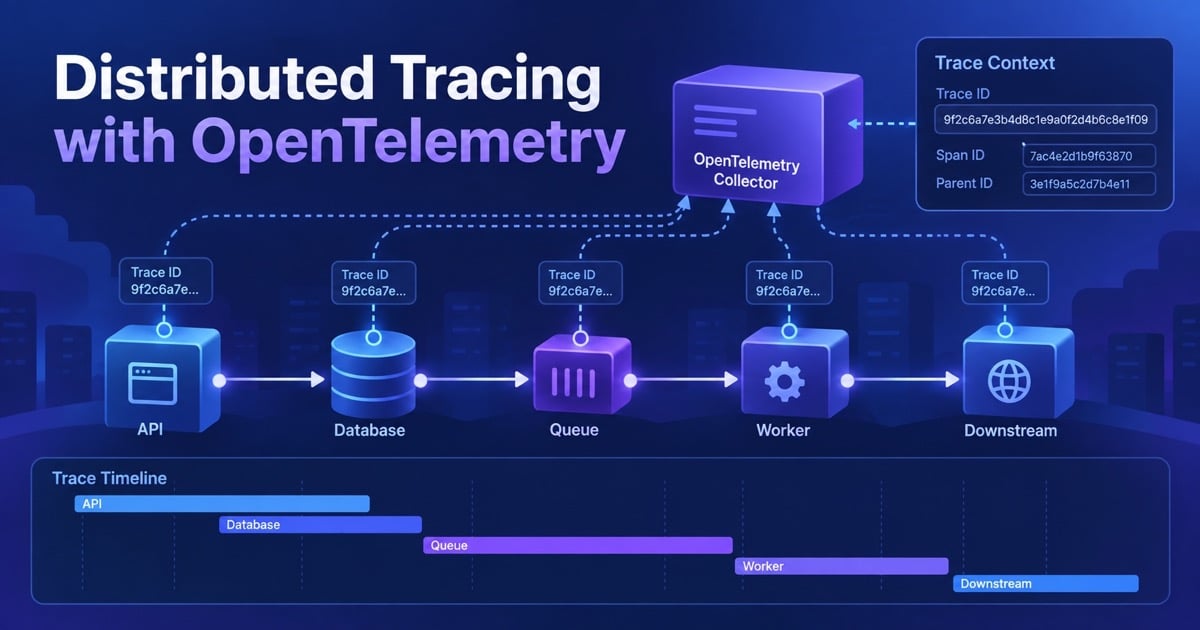
One request crosses an API gateway, checkout service, database, payment provider, and email queue. Each service says it took 40 ms, but the user waited two seconds. Distributed tracing preserves the parent-child relationship between those operations so the slow span and its upstream impact are visible.
This guide explains trace IDs, span IDs, context propagation, sampling, OpenTelemetry, and queue boundaries. Continue from backend observability, timeouts, and webhook delivery.
Table of Contents
Open Table of Contents
Trace, Span and Context
A trace represents one end-to-end operation. A span represents a timed operation within it, with a name, start and end time, attributes, events, status, and links. The trace ID groups the spans; the span ID identifies one node; the parent ID describes the call relationship.
flowchart TD
    A[API span] --> B[Checkout span]
    B --> C[Database span]
    B --> D[Payment HTTP span]
    B --> E[Publish message span]
    E --> F[Email consumer span]
    D --> G[Provider child span]
A trace can contain asynchronous work that outlives the original request. Use a span link or a propagated parent context for message consumption, but do not pretend a queue consumer is a synchronous child if it executes minutes later. The distinction affects duration, sampling, and user-facing latency.
Propagation Across Services
HTTP and gRPC clients propagate W3C Trace Context headers such as traceparent. Message producers put the context in message headers; consumers extract it and create a new processing span. Schedulers should create a trace for each job run and link it to the triggering event where available.
Propagation can cross trust boundaries, so strip or regenerate context from untrusted public input and avoid putting customer secrets in baggage. Keep correlation IDs separate from trace IDs when a business workflow needs a durable identifier that survives sampling and retention.
OpenTelemetry Pipeline
OpenTelemetry provides vendor-neutral APIs and SDKs for creating telemetry, a collector for processing it, and exporters for metrics, logs, and traces. Applications should instrument once and choose a backend without coupling business code to a vendor-specific client.
flowchart TD
    A[Instrumented service] --> B[OpenTelemetry SDK]
    B --> C[OTel Collector]
    C --> D[Sampling and redaction]
    D --> E[Trace backend]
    D --> F[Metrics backend]
    D --> G[Log backend]
Use auto-instrumentation for common HTTP, database, and messaging libraries, then add manual spans around business decisions and external calls. A span named POST /orders is useful; a span named doThing with no attributes is not. Standardize service name, deployment version, region, and route attributes.
Sampling and Privacy
Head sampling decides at the start whether a trace is recorded; tail sampling can keep traces that contain errors or high latency after seeing the full trace. Tail sampling needs collector memory and careful failure behavior. Always keep error traces and a representative baseline, and use metrics for complete population-level SLOs.
Trace attributes can contain URLs, SQL, headers, and user data. Redact authorization tokens, card details, and personal information. Define retention, access, encryption, and deletion policies before sending traces to a shared backend.
Debugging with Traces
Start with a failing trace and compare it to a healthy trace for the same route and version. Look for long spans, queue age between producer and consumer, retries, fan-out, lock waits, and missing child spans. Then correlate the trace ID with structured logs and metrics to determine whether the issue is broad or isolated to a tenant, zone, or deployment.
Do not use traces as a substitute for profiling or database plans. A trace can show that a query took 800 ms; a database metric or plan explains why. Use the signal that answers the current question and link the evidence through IDs.
Interview Questions
1. What is the difference between a trace and a span?
A trace is the end-to-end operation; a span is one timed operation inside it. Parent-child relationships and links connect spans across service and asynchronous boundaries. A trace can contain many spans and may cross queues or external systems.
2. How does trace context cross a message queue?
The producer serializes trace context into message headers. The consumer extracts it and creates a processing span, often with a link to the producer span because the work is not synchronous. This preserves the workflow while keeping queue delay visible.
3. Why use OpenTelemetry?
It standardizes instrumentation and context propagation across languages and vendors. Teams can route telemetry through a collector for sampling, redaction, and export without rewriting business code. It does not automatically solve cardinality, privacy, or instrumentation quality.
4. What is tail sampling?
Tail sampling waits until a trace is complete or sufficiently observed before deciding whether to retain it. It can preferentially keep errors and slow traces, but it requires collector state and capacity. Head sampling is cheaper and deterministic at the start.
5. Why can traces be misleading?
Sampling may omit a trace, instrumentation may miss a boundary, clocks may be skewed, and a span can measure a client wait rather than server work. Compare traces with metrics and logs, inspect propagation, and treat the trace as evidence rather than an infallible timeline.
Conclusion
Distributed tracing turns a cross-service latency mystery into a connected set of spans. Propagate context through HTTP, RPC, queues, and jobs; instrument meaningful operations; use OpenTelemetry collectors for sampling and privacy; and correlate traces with metrics and logs. The result is faster diagnosis without pretending one signal explains every failure.
References
YouTube Videos
- “OpenTelemetry Explained for Beginners - Traces, Metrics & Logs” - The Devops Duo [https://www.youtube.com/watch?v=Qg4aPDZFbkA]