 ADevGuide
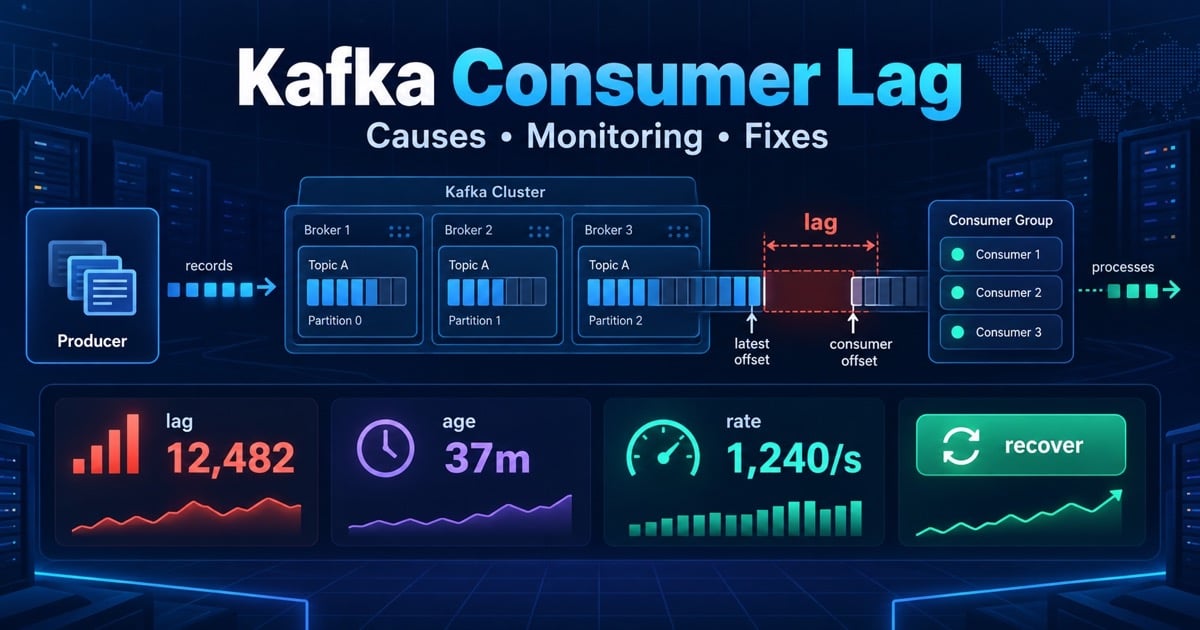
An order topic can show only a few thousand lagging records and still miss its SLA: on a quiet topic, those records may be hours old. On a high-throughput topic, a million records may clear in seconds. Kafka consumer lag is not just a number to reduce; it is a signal about age, capacity, partition ownership, and downstream health.
This guide explains how lag is calculated, how to separate normal backlog from an incident, and how to fix slow consumers without creating a database or hot-partition failure. Continue from Kafka consumer groups, Kafka offsets, and Kafka delivery guarantees.
Table of Contents
Open Table of Contents
What Kafka Consumer Lag Means
For a topic partition, a common approximation is:
lag = log end offset - committed consumer-group offsetThe log end offset (LEO) is the next position a producer will append. The committed offset is the group’s durable recovery position. If LEO is 10,500 and the group has committed 10,000, the partition has about 500 records of committed lag. The running consumer may have fetched some of those records already, so current position and committed position can differ during a batch.
flowchart TD
    A[Producer appends] --> B[Log end offset: 10500]
    C[Consumer group commits] --> D[Committed offset: 10000]
    B --> E[Lag: 500 records]
    D --> E
    E --> F[Measure age and recovery rate]
Lag is scoped by consumer group, topic, and partition. One topic can be healthy for analytics and badly behind for inventory because each group has independent offsets and processing costs. Always preserve those dimensions in dashboards and incident queries.
Lag Count, Lag Rate and Lag Age
Count answers “how many records are behind now?” Rate answers “is the backlog growing or shrinking?” Age answers “how long has the oldest unprocessed event waited?” A useful dashboard shows all three:
| Signal | Calculation or example | What it tells you |
|---|---|---|
| Lag count | LEO - committed offset | Current backlog volume |
| Ingress rate | Records appended per second | Incoming workload |
| Consume rate | Records processed per second | Consumer capacity |
| Lag rate | Ingress rate minus consume rate | Whether backlog grows or drains |
| Lag age | Current time minus oldest record timestamp | User-visible freshness |
If ingress is 8,000 records/second and a group consumes 7,500, lag grows by roughly 500 records/second. If the consumer later sustains 9,000, the backlog drains at 1,000 records/second. Recovery time is approximately backlog / drain rate, assuming the downstream system remains healthy.
Record timestamps can be misleading when producers have clock skew or events wait in an upstream buffer. Pair age with broker append time, consumer processing latency, and an end-to-end freshness metric. A quiet partition’s count can look harmless while its oldest event violates the SLA.
Common Causes of Lag
Slow downstream work
Database locks, synchronous HTTP calls, large batch writes, garbage collection, or CPU-heavy deserialization can reduce records per second. Check handler latency percentiles and downstream saturation before adding consumers. More concurrency can simply move the queue into the database.
Too few consumers or partitions
A consumer group cannot have more active owners for a topic than the topic has partitions. If every partition is busy and processing is balanced, adding consumers will not help; the topic needs a deliberate partitioning and key strategy. See Kafka partitions for the ordering and overhead trade-off.
Hot partition or hot key
Group-wide lag can hide one partition that is far behind while other partitions are idle. A hot key, uneven message sizes, or one slow downstream tenant can create that skew. Per-partition lag and max-to-median ratios expose it.
Rebalances and poll-loop violations
Consumers that exceed max.poll.interval.ms, miss heartbeats, or repeatedly restart lose ownership and spend time reassigning partitions instead of processing. Deployments that stop all members at once can cause a larger pause than a rolling, graceful change.
Broker, network, or retention pressure
Fetch latency, throttling, under-replicated partitions, disk saturation, or network errors can reduce input even when the handler is fast. Check broker health and client fetch metrics before tuning application threads.
Commit and poison-record behavior
A consumer may process a record repeatedly but never commit past it because a permanent schema or business error blocks the partition. The safe response is a bounded retry and dead-letter path that retains the original event metadata, not an unconditional offset skip.
A Production Diagnosis Runbook
Use a consistent order so an urgent scale-up does not hide the cause:
- Confirm scope: identify the group, topic, affected partitions, first increase time, and freshness SLO.
- Check rates: compare ingress, consume, lag growth, and estimated drain time.
- Inspect ownership: compare active consumers with partitions and look for recent rebalances or restarts.
- Find skew: rank partitions by lag, record size, processing time, and key distribution.
- Trace the handler: inspect database latency, locks, HTTP calls, CPU, memory, GC, and error retries.
- Check brokers: review fetch latency, throttles, disk, network, leader balance, and under-replication.
- Apply the smallest fix: remove a downstream bottleneck, quarantine a poison record, add capacity, or intentionally pause ingress.
- Verify recovery: lag count and age must fall at the expected drain rate without downstream error or duplicate spikes.
# Describe committed offsets, end offsets, and lag by partition.
kafka-consumer-groups.sh \
  --bootstrap-server kafka:9092 \
  --describe --group inventory

# Inspect group membership when assignments or rebalances look suspicious.
kafka-consumer-groups.sh \
  --bootstrap-server kafka:9092 \
  --describe --group inventory --members --verbose
Do not reset offsets merely to make a dashboard green. A reset can discard business events or replay a large range into a non-idempotent sink. Treat it as an incident action with an owner, a dry run, and a recovery plan.
Scaling Without Making the Incident Worse
Add consumers only when partitions are available and the downstream dependency has headroom. If 12 partitions are assigned to 12 consumers and each handler waits on a saturated database, a thirteenth consumer is idle and a larger database connection pool may deepen contention. First reduce per-record latency, batch safe writes, cache stable lookups, or route poison records away from the hot path.
When partitions are available, scale gradually and watch rebalance duration, fetch rate, handler latency, database utilization, and lag age. Use cooperative assignment and graceful shutdown where supported so a deployment does not revoke every partition at once. Maintain idempotent effects because ownership changes and retries can replay a record.
For a hot key, more consumers cannot split one ordered partition. Revisit the key only if the business invariant allows it. Otherwise optimize the serial handler, isolate that tenant, or create a workflow that can process independent sub-operations after the ordered decision.
Capacity Planning Example
Suppose peak ingress is 24,000 records/second. Load testing shows one consumer instance safely processes 3,000 records/second while keeping database latency below its SLO. The steady-state requirement is:
24,000 / 3,000 = 8 active consumersWith 12 partitions, eight consumers can run normally and four partitions provide placement flexibility. If a consumer fails, the remaining seven handle about 21,000 records/second, so lag grows until capacity is restored. To recover a 120,000-record backlog with nine consumers at 3,000 each, the drain rate is 3,000 records/second above ingress only if ingress stops; otherwise calculate against the actual difference.
Capacity math must include record bytes, downstream calls, batch size, partition skew, retry traffic, and recovery objectives. A partition count that works for average traffic may fail during a deploy or a hot-key event. Re-test after changing message size, retention, replication, or handler behavior.
Alerting and Recovery SLOs
Alert on symptoms users feel and causes operators can act on:
- Consumer lag age above the freshness SLO for a sustained window.
- Lag growth rate positive for several evaluation periods.
- Max partition lag materially above the median.
- Consumer group with fewer active members than expected or frequent rebalances.
- Consume rate below the tested baseline, fetch latency high, or commit errors rising.
- Under-replicated partitions, broker throttling, or a dead-letter rate spike.
Set a recovery target, such as “clear a 10-minute backlog within 15 minutes while keeping order processing under 2 seconds.” Alert thresholds should account for normal bursts and planned replays. A static “lag > 1,000” threshold is not portable between a high-volume payment topic and a low-volume audit topic.
Production Incident Example
An inventory group reads 24 partitions. One database index migration increases write latency from 15ms to 90ms, reducing consumer throughput below ingress. Lag age rises only on four partitions because their keys map to the affected tenant. The team first confirms broker fetch health and identifies the database wait; adding eight consumers would only increase lock contention.
They pause the migration, move a permanent poison record to a DLQ, and restore the index. Consume rate exceeds ingress, lag age falls at the predicted drain rate, and the team verifies no duplicate stock updates because the sink uses an inbox key. The post-incident action is a per-partition lag-age alert and a load test that includes the migration’s write profile.
Interview Questions
1. How is Kafka consumer lag calculated?
For each topic partition, a common calculation is log end offset minus the consumer group’s committed offset. I explain that current position may be ahead of committed position during processing and that lag must be grouped by consumer group and partition. I also add lag age because record count alone does not express freshness.
2. What is the first thing you check when lag grows?
I compare ingress and consume rates, then determine whether all partitions or only a few are affected. Next I check consumer membership and rebalances, followed by handler and downstream latency. This separates a capacity problem from a hot partition, poison record, broker issue, or deployment pause.
3. Will adding consumers always reduce lag?
No. A group cannot use more active consumers than the topic has partitions, and a saturated database may become the new bottleneck. I add consumers only when unassigned partitions and downstream headroom exist, then validate lag age, processing latency, and error rate during the rollout.
4. How do you handle one partition with much higher lag?
I inspect key distribution, record size, processing time, and downstream tenant behavior. If the key’s ordering boundary is too broad and business semantics allow it, I redesign the key; otherwise I optimize or isolate the serial workflow. More consumers cannot split one partition safely within the same group.
5. Should you reset offsets to fix consumer lag?
Usually not. Resetting can discard events or replay them into a non-idempotent sink, so I first fix the processing bottleneck or quarantine a poison record. If a reset is approved, I capture current offsets, dry-run the range, confirm sink idempotency, and record the business decision.
6. What metric is better than lag count?
Lag age is often better for a user-facing freshness SLO, while lag growth rate predicts whether the incident is worsening. I use count, age, ingress, consume rate, and max-per-partition together. No single metric explains both a quiet topic with old records and a busy topic with a rapidly clearing burst.
Conclusion
Kafka consumer lag is a capacity and freshness signal, not a score to zero blindly. Calculate it per partition, pair count with age and rate, identify the real bottleneck, and scale only when partitions and downstream systems can support more work. A repeatable runbook and idempotent sink turn lag recovery into controlled operations instead of offset roulette.
References
YouTube Videos
- “Kafka Consumer Lag Explained | Why Your Consumers Fall Behind” - LevelUp With Suhail [https://www.youtube.com/watch?v=ISLJljEwrao]