Your API returned 500 at 2:13 AM. The user says checkout failed. The payment provider says the charge never arrived. Your database looks healthy. Without good logs, you are now guessing in production.
Backend logging is how applications leave a useful trail of what happened: which request came in, which service handled it, what failed, and what context matters for debugging. This guide explains how logging works in backend systems and why production teams treat logs as part of the system design, not as random console.log leftovers.
If you are following the learning path, read What Is a Message Queue? Simple Explanation with Examples, What Is High Availability?, and How APIs Work: A Simple Guide for Beginners alongside this post. For the broader roadmap, use the Practical Backend Engineering series as the pillar page and the Backend tag as a category page.
Table of Contents
Open Table of Contents
- What Is Backend Logging?
- Why Logs Matter in Production
- How a Log Event Flows Through a Backend System
- Log Levels Explained
- Structured Logs vs Plain Text Logs
- Correlation IDs and Request Context
- Centralized Logging Architecture
- A Practical Node.js Logging Example
- What Not to Log
- Real-World Examples
- Common Logging Mistakes
- Interview Questions
- Conclusion
- References
- YouTube Videos
What Is Backend Logging?
Backend logging is the practice of recording events from server-side code so developers and operators can understand system behavior later. A log might describe an incoming HTTP request, a database timeout, a payment failure, a background job retry, or a configuration problem during startup.
The important word is event. A useful log is not just a string printed to a terminal. It is a record of something that happened at a specific time, with enough context for another person or tool to search, filter, and reason about it.
A simple log message might look like this:
Payment failed for order ord_123That is better than nothing, but it leaves too many questions. Which user? Which provider? Was it a timeout, validation error, or declined card? Which request triggered it? Did it happen once or 5,000 times?
A production-quality log event carries richer context:
{
  "timestamp": "2026-05-15T20:49:10.421Z",
  "level": "error",
  "service": "checkout-api",
  "event": "payment_failed",
  "requestId": "req_7f42",
  "orderId": "ord_123",
  "provider": "stripe",
  "errorCode": "provider_timeout",
  "durationMs": 2400
}
This version can be searched by requestId, grouped by errorCode, filtered by service, and turned into dashboards or alerts. That is the difference between “we printed something” and “we can debug production.”
Why Logs Matter in Production
Logs matter because production behavior is rarely visible from code alone. Your code says what should happen. Logs show what actually happened for real users, real traffic, real dependencies, and real failures.
In a small app running on one server, you might SSH into the machine and inspect a file. In a modern backend, the request may cross a load balancer, API server, message queue, worker, database, cache, and third-party API. That is the same kind of distributed flow discussed in What Is a Message Queue? Simple Explanation with Examples: work moves between components, and failures can happen after the original HTTP request has already returned.
Good logging helps with four everyday jobs:
- Debugging: Find the exact failure path for a request.
- Incident response: Understand whether an issue is isolated or system-wide.
- Auditability: Track important business or security events.
- Operational learning: See patterns that should influence future design.
The trade-off is cost and noise. Logging everything at maximum detail can slow systems down, leak sensitive data, and create huge storage bills. Logging too little leaves teams blind. The skill is choosing the right events, the right fields, and the right retention.
How a Log Event Flows Through a Backend System
At a high level, backend logs usually follow this path:
flowchart TD
    A[Backend Service] --> B[Logger Library]
    B --> C[Stdout or Log File]
    C --> D[Log Agent]
    D --> E[Central Log Store]
    E --> F[Search and Dashboards]
    E --> G[Alerts]
    F --> H[Developer Debugging]
    G --> H
Here is the flow in plain English:
- Application code records an event using a logger library.
- The logger formats the event with a timestamp, level, message, and fields.
- The event is written to standard output, a file, or a platform logging sink.
- A log agent or cloud runtime collects the event.
- Logs are shipped to a central system such as CloudWatch Logs, Google Cloud Logging, Elastic Stack, Loki, Datadog, or another observability backend.
- Developers search logs during incidents, build dashboards, and configure alerts for important patterns.
The central collection step is what makes logging useful beyond one machine. If you run ten API instances behind a load balancer, the failing request could land on any one of them. Centralized logging gives the team one place to ask, “Show me every error for request req_7f42 across all services.”
Log Levels Explained
Log levels describe how important a log event is. Different frameworks use slightly different names, but the common levels are:
| Level | Meaning | Example |
|---|---|---|
debug | Detailed information for development or temporary investigation | SQL query timing for a local test |
info | Normal business or system events | Server started, order created |
warn | Something unusual happened, but the system can continue | Retry scheduled after provider timeout |
error | A request or job failed and needs attention | Payment capture failed |
fatal | The process cannot safely continue | Required configuration missing at startup |
The most common mistake is treating log levels as decoration. They should drive behavior.
In production, info, warn, and error are usually enough for normal operation. debug should be used carefully because it can be expensive and noisy. fatal should be rare; if everything is fatal, nothing is.
When I choose a level, I ask: Who needs to act on this?
- If no one needs to act and it is normal behavior, use
info. - If the system recovered but the event might become a problem, use
warn. - If user-visible work failed, use
error. - If the process must stop, use
fatal.
That discipline keeps logs useful during real incidents, when every irrelevant line slows someone down.
Structured Logs vs Plain Text Logs
Plain text logs are easy for humans to read:
User usr_42 placed order ord_123 in 184msStructured logs are easier for machines to query:
{
  "level": "info",
  "event": "order_created",
  "userId": "usr_42",
  "orderId": "ord_123",
  "durationMs": 184
}
For backend systems, structured logs are usually the better default. They let you search event = order_created, sort by durationMs, count failures by provider, and join logs mentally with metrics and traces.
The trade-off is readability. Raw JSON is not as pleasant in a local terminal. Many teams solve that by using pretty local formatting in development and JSON in production. The underlying event fields stay consistent, while the display changes by environment.
The field names matter. Pick names that remain stable:
requestIdtraceIdserviceenvironmenteventuserIddurationMserrorCode
Stable fields let dashboards, alerts, and runbooks keep working as the codebase grows.
Correlation IDs and Request Context
A correlation ID is a unique value attached to a request so every log line related to that request can be found together.
Imagine this flow:
flowchart TD
    A[Client Request] --> B[API Gateway]
    B --> C[Checkout API]
    C --> D[Payment Service]
    C --> E[Order Database]
    C --> F[Message Queue]
    F --> G[Email Worker]
If each service logs independently with no shared ID, debugging is painful. You have to guess timestamps and search broad error messages. With a requestId or traceId, every service can include the same identifier:
{ "service": "checkout-api", "requestId": "req_7f42", "event": "checkout_started" }
{ "service": "payment-service", "requestId": "req_7f42", "event": "payment_timeout" }
{ "service": "checkout-api", "requestId": "req_7f42", "event": "checkout_failed" }
This is where logging starts to overlap with tracing. Tracing shows the timing and relationship between spans. Logs explain the specific events and decisions inside those spans. You do not have to master distributed tracing on day one, but you should learn to preserve request context early.
In web APIs, the common pattern is:
- Accept an incoming
X-Request-IDheader if a trusted upstream provides one. - Generate a new ID if the request does not have one.
- Add the ID to every log event created while handling the request.
- Pass the ID to downstream services and background jobs.
That one habit can turn a production investigation from an hour of guessing into a few targeted searches.
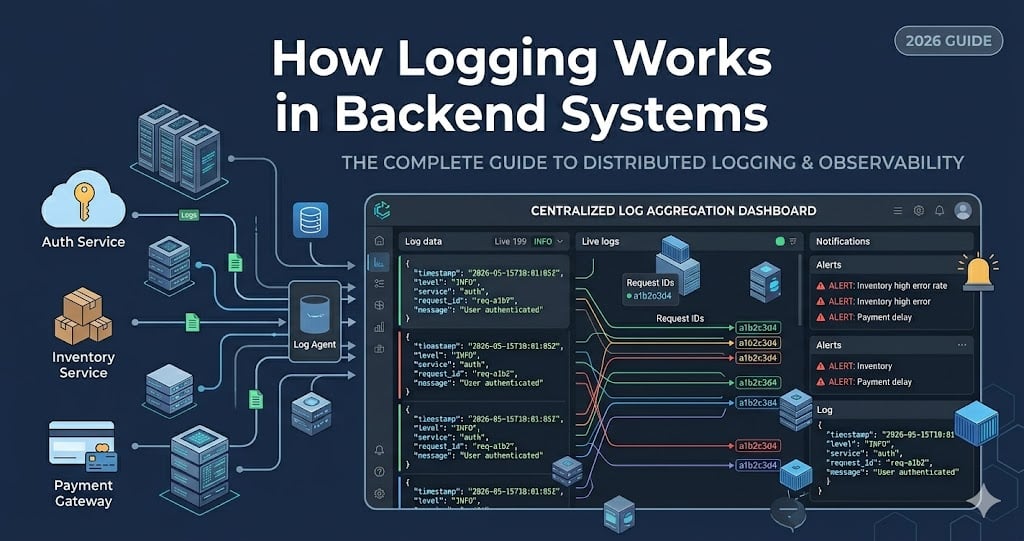
Centralized Logging Architecture
Centralized logging means logs from many machines, containers, and services land in one searchable place.
This matters because modern backends are dynamic. Instances restart. Containers move. Autoscaling adds and removes workers. If logs only live on local disks, they disappear exactly when you need them most.
A common production architecture looks like this:
flowchart TD
    A[API Containers] --> D[Stdout]
    B[Worker Containers] --> D
    C[Database Proxy] --> D
    D --> E[Log Collector]
    E --> F[Parse and Enrich]
    F --> G[(Log Storage)]
    G --> H[Search UI]
    G --> I[Alerts]
    G --> J[Long-Term Archive]
The log collector might be a cloud platform feature, a sidecar, an agent on each node, or a daemonset in Kubernetes. Its job is to collect logs reliably without forcing every application to know the details of the final logging backend.
The backend then handles search, indexing, retention, access control, and alerting. This is where cost decisions become real. High-volume debug logs may only be retained for a few days. Security or audit events may need longer retention. Sensitive data needs strict access control.
If your system is still small, you do not need the fanciest stack. But you should still design logs as if they will be collected centrally later: structured fields, consistent levels, request IDs, and no secrets.
A Practical Node.js Logging Example
Here is a small Express-style example using Pino, a common structured logger in Node.js.
import crypto from "node:crypto";
import express from "express";
import pino from "pino";

const logger = pino({
  level: process.env.LOG_LEVEL ?? "info",
  base: {
    service: "checkout-api",
    environment: process.env.NODE_ENV ?? "development",
  },
});

const app = express();
app.use(express.json());

app.use((req, res, next) => {
  const requestId = req.header("x-request-id") ?? crypto.randomUUID();
  req.requestId = requestId;
  res.setHeader("x-request-id", requestId);

  req.log = logger.child({ requestId });
  next();
});

app.post("/orders", async (req, res) => {
  const startedAt = Date.now();

  try {
    const order = await createOrder(req.body);

    req.log.info(
      {
        event: "order_created",
        orderId: order.id,
        durationMs: Date.now() - startedAt,
      },
      "Order created"
    );

    res.status(201).json({ orderId: order.id });
  } catch (error) {
    req.log.error(
      {
        event: "order_create_failed",
        errorName: error.name,
        errorMessage: error.message,
        durationMs: Date.now() - startedAt,
      },
      "Order creation failed"
    );

    res.status(500).json({ error: "Unable to create order" });
  }
});

async function createOrder(payload) {
  if (!payload.items?.length) {
    throw new Error("Order must contain at least one item");
  }

  return { id: "ord_123" };
}

app.listen(3000, () => {
  logger.info({ event: "server_started", port: 3000 }, "Server started");
});
There are a few production-minded details here:
- The logger emits structured JSON by default.
- Every request gets a
requestId. - The request ID is added to child loggers so handlers do not repeat it manually.
- Successful and failed order creation both record an
eventname. - The response hides internal error details from the user, while logs preserve debugging context.
In a real system, I would also avoid logging full request bodies by default. Request bodies often contain passwords, tokens, addresses, payment details, or other data that should not be copied into log storage.
What Not to Log
Logging is powerful because it copies information out of the running application. That is also why it can be dangerous.
Do not log:
- passwords
- API keys
- session tokens
- JWTs
- credit card numbers
- full authentication headers
- private personal data unless there is a clear, approved reason
- huge request or response bodies
The safest pattern is to log identifiers and high-level facts, not raw sensitive values.
For example, this is risky:
{
  "event": "login_failed",
  "email": "ada@example.com",
  "password": "correct-horse-battery-staple"
}
This is safer:
{
  "event": "login_failed",
  "userId": "usr_42",
  "reason": "invalid_password",
  "ipHash": "ip_8e1f"
}
Even then, privacy and compliance rules depend on the business. A healthcare system, bank, or enterprise SaaS product may have stricter requirements for retention, redaction, access control, and audit trails.
The rule I use is simple: assume logs will be read by more systems and more people than application data. If that makes a field uncomfortable, redact it.
Real-World Examples
Ecommerce checkout
In checkout, logging needs to answer one question quickly: where did the order fail?
A good checkout flow logs events such as checkout_started, payment_authorized, inventory_reserved, order_created, and confirmation_email_enqueued. Each event should include a request ID, order ID, user ID, and duration. If payment fails, the logs should distinguish between a declined payment, a provider timeout, a validation bug, and an internal exception.
The goal is not to log every object in memory. The goal is to preserve the business path clearly enough that support and engineering can reconstruct what happened.
Background job processing
In a queue-based system, logging is essential because work happens after the original request. A worker should log when it receives a job, when it retries, when it succeeds, and when it sends a job to a dead-letter queue.
This connects directly to the reliability patterns in What Is a Message Queue? Simple Explanation with Examples. Without worker logs, a queue can hide failures for a long time. With good logs, you can search by job ID and see every attempt.
Authentication and security
Authentication logs are useful for detecting suspicious behavior, but they must be careful. You want to know about repeated login failures, password reset attempts, permission denials, and unusual access patterns. You do not want passwords, raw tokens, or full session cookies in the log stream.
For security events, stable event names and consistent fields matter more than clever prose. A field like event: "permission_denied" is easier to alert on than twenty slightly different English sentences.
Microservices debugging
In a microservices system, a single user action can touch many services. Correlation IDs and centralized logs become non-negotiable. Without them, the team ends up searching each service separately and guessing which timestamp belongs to which request.
The practical rule is: if one request crosses service boundaries, the request context should cross with it.
Common Logging Mistakes
1. Logging only the error message
Database timeout is not enough. Which query? Which request? Which user or tenant? How long did it wait? Which database host? Context turns a message into a useful diagnostic event.
2. Logging too much at info
If every tiny branch logs at info, real incidents become hard to read and expensive to store. Use debug for temporary detail and keep normal production logs focused on meaningful lifecycle events.
3. Using inconsistent event names
If one service logs payment failed, another logs payment_failure, and a third logs stripe error, dashboards become brittle. Pick event names and keep them stable.
4. Forgetting request IDs
Request IDs are one of the highest-return logging habits. Without them, a distributed system becomes a pile of unrelated timestamps.
5. Logging secrets by accident
This is the mistake that turns a debugging tool into a security incident. Redact sensitive headers, tokens, passwords, and raw payment data before logs leave the process.
6. Treating logs as the only observability signal
Logs are not a replacement for metrics or traces. Metrics tell you that the error rate is rising. Traces show where requests spend time. Logs explain specific events. Strong backend observability uses all three, with logs carrying the narrative details.
Interview Questions
1. What is backend logging?
Backend logging is the practice of recording events from server-side applications so teams can understand what happened during requests, jobs, failures, and operational changes. A good log includes a timestamp, level, event name, and enough context to debug the situation later. I would emphasize that logging is not just printing strings; it is creating searchable operational data. In production, logs help with debugging, incident response, audits, and learning how the system behaves under real traffic.
2. What is the difference between structured logging and plain text logging?
Plain text logging writes human-readable messages, while structured logging writes fields such as event, requestId, userId, and durationMs in a machine-readable format like JSON. Plain text is convenient locally, but structured logs are much easier to search, filter, aggregate, and alert on in production. For backend systems, I usually choose structured logs because incidents often require queries like “show all checkout failures grouped by provider.” The trade-off is that raw JSON can be less pleasant to read without tooling.
3. Why are correlation IDs important?
Correlation IDs connect all logs related to the same request or workflow. Without a shared ID, debugging a request that crosses multiple services requires guessing from timestamps and partial messages. With a requestId or traceId, you can search once and see the path through the API, worker, payment service, and queue. This becomes especially important in distributed systems where one user action can create logs in many places.
4. How do you choose the right log level?
I choose the log level based on the action someone should take. Normal lifecycle events belong at info, unusual recoverable events belong at warn, failed user-visible work belongs at error, and process-ending failures belong at fatal. debug is useful for development or short investigations, but it should not be left on everywhere in production without a reason. The goal is to make logs useful during incidents, when noisy levels slow people down.
5. What should you avoid logging?
You should avoid logging passwords, tokens, API keys, session cookies, full authorization headers, raw payment data, and unnecessary personal information. Logs often go to third-party systems, are retained longer than expected, and are readable by more people than application databases. A safer approach is to log stable identifiers and high-level reasons instead of raw sensitive values. Redaction should happen before logs leave the application process.
6. How does centralized logging help in a backend system?
Centralized logging collects logs from many services, containers, and machines into one searchable system. This matters because modern applications run across multiple instances, and the failing request could land anywhere. Centralization allows teams to search by request ID, service, event, or error code without logging into individual servers. It also enables dashboards, alerts, retention policies, and access control around log data.
Conclusion
- Backend logging records production events so teams can debug real behavior instead of guessing from code.
- Structured logs are usually better than plain text logs for production systems because fields are searchable and alertable.
- Log levels should communicate severity and expected action, not just decorate messages.
- Correlation IDs make distributed debugging practical by tying related logs together.
- Centralized logging is essential once your backend runs across multiple instances or services.
- Logging must be designed with security in mind because logs can leak sensitive data if teams are careless.
The next topic in this series covers What Is Application Performance Monitoring (APM)? Beginner Guide - how metrics, alerts, uptime checks, and dashboards complement logs.
If you want to connect logging to asynchronous work, revisit What Is a Message Queue? Simple Explanation with Examples, where worker retries and dead-letter queues make logs especially important.
References
-
Logging best practices - AWS Prescriptive Guidance
https://docs.aws.amazon.com/prescriptive-guidance/latest/logging-monitoring-for-application-owners/logging-best-practices.html -
Logging - Node.js Reference Architecture
https://nodeshift.dev/nodejs-reference-architecture/operations/logging/ -
Cloud Logging - Google Cloud
https://cloud.google.com/logging -
Logs - OpenTelemetry Documentation
https://opentelemetry.io/docs/concepts/signals/logs/
YouTube Videos
-
“Observability 2.0: Transforming Logging & Metrics - Charity Majors & James Lewis”
https://www.youtube.com/watch?v=p5W_VCJ_2d0 -
“Centralized Logging To Elasticsearch, Logstash, Kibana ELK Stack”
https://www.youtube.com/watch?v=hx89XA540zE