 ADevGuide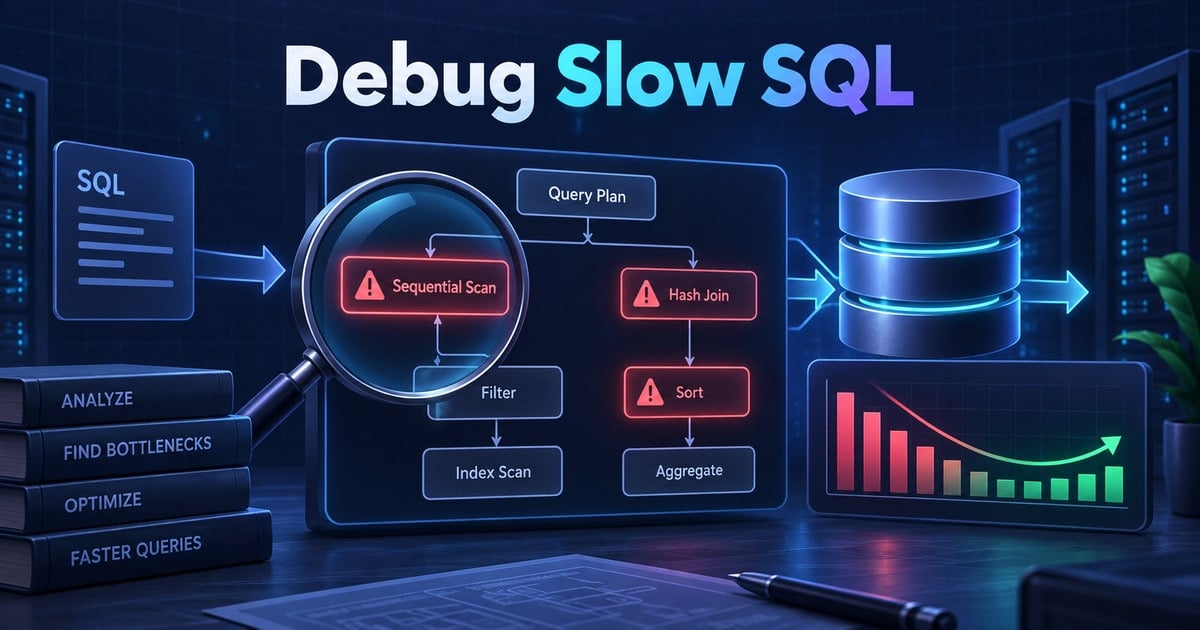
An endpoint that normally takes 40 milliseconds suddenly takes four seconds after a marketing campaign. It is tempting to add an index, increase database CPU, or blame the ORM. Those are guesses. A slow SQL query is a measurable execution problem: find the query, determine whether it is waiting or doing too much work, inspect its actual plan, change one cause, and prove the result.
This guide gives that workflow. It assumes you know the basics of database indexing and focuses on evidence: query frequency, execution plans, actual rows, locks, and safe verification. It follows the replication discussion because a read replica cannot rescue a query that wastes work on every node.
Table of Contents
Open Table of Contents
Start With the User-Facing Symptom
“The database is slow” is not enough to tune. First identify the endpoint, time window, affected parameters, and service-level target. A query that takes 800 milliseconds once per night may be fine; a 120-millisecond query called 500 times by one page is not. Trace one slow request from the application to its SQL statements and normalize parameter values when grouping similar queries.
Record a baseline before editing anything:
| Signal | Why it matters |
|---|---|
| p50, p95, and p99 elapsed time | Averages hide tail latency. |
| Calls per request and calls per minute | Reveals N+1 patterns and high total cost. |
| Rows returned and rows scanned | Separates useful work from waste. |
| CPU time, I/O, and lock wait time | Distinguishes execution from waiting. |
| Representative parameters | A plan for a rare tenant may differ from a typical tenant. |
Do not optimize an isolated SQL string if the request actually makes 101 small queries. That is an application access-pattern problem, often called N+1. The correct fix may be batching or preloading, not a new database index.
Classify the Delay: Waiting or Working
The first diagnostic split is simple: is the query consuming CPU or I/O because its plan does too much work, or is it waiting for another resource? These failures have different fixes.
flowchart TD
    A[Slow request observed] --> B[Identify normalized SQL and parameters]
    B --> C{Is it waiting?}
    C -->|Yes| D[Inspect locks, connection pool, disk, CPU pressure]
    C -->|No| E[Capture actual execution plan]
    D --> F[Remove contention or capacity bottleneck]
    E --> G[Find expensive operator and row mismatch]
    G --> H[Change one query or index cause]
    H --> I[Compare baseline and result]
A query may be blocked behind a transaction that holds a row lock. Adding an index will not free that lock. It may wait for a connection because the pool is exhausted, or for disk because another workload is saturating I/O. Long transactions and incompatible locks are covered in the database deadlocks guide; connection saturation belongs with connection pooling.
When the query is actively running, its execution plan is the next source of truth. Plans show the physical operations chosen to satisfy declarative SQL: scans, joins, filters, sorts, aggregates, and their estimated cost.
Capture a Safe Query Baseline
Use a production-safe observability tool, slow-query log, query store, or database statistics view to find expensive normalized statements. Capture the literal query only with appropriate redaction; SQL parameters can contain personal or secret data.
For PostgreSQL, EXPLAIN (ANALYZE, BUFFERS) executes the statement and reports actual time, rows, loops, and buffer activity:
EXPLAIN (ANALYZE, BUFFERS)
SELECT id, customer_id, total_amount, created_at
FROM orders
WHERE tenant_id = 42
  AND status = 'PLACED'
ORDER BY created_at DESC
LIMIT 50;
ANALYZE is powerful because it reports what happened, not only what the optimizer predicted. It also runs the query. Never point it casually at a costly production write, an unbounded report, or a statement with side effects. Use a read-only transaction, a safe replica where semantics allow it, or a production-like environment. MySQL and SQL Server expose equivalent plan and runtime tooling, but syntax and output differ.
Capture both a slow plan and, if available, a historically fast plan. A regression often becomes obvious when estimates, input cardinality, indexes, or join choices changed.
Read EXPLAIN ANALYZE From the Leaves Up
Plans are trees. A parent cannot finish until its child operations have supplied rows, so begin near the leaves and ask four questions at every expensive node:
- How many rows did the planner estimate, and how many did it actually receive?
- How many loops executed this node?
- Did the operation scan, sort, hash, or join far more data than the final result needs?
- Is elapsed time dominated by CPU, reads, spills, or a wait outside the plan?
Consider this simplified shape:
Limit  (actual time=0.08..1450.12 rows=50 loops=1)
  -> Sort  (actual time=1450.07..1450.09 rows=220000 loops=1)
       Sort Key: created_at DESC
       -> Seq Scan on orders
            (actual time=0.03..940.40 rows=220000 loops=1)
            Filter: tenant_id = 42 AND status = 'PLACED'
The Limit returns only 50 rows, but the database scans 220,000 rows and sorts all of them first. The issue is not the limit; the plan lacks a path that filters and orders efficiently. A candidate composite index may be (tenant_id, status, created_at DESC), but confirm the data distribution and write cost before creating it. The column-order reasoning is explained in composite indexes.
Estimates versus actual rows
Large differences between estimated and actual rows are a red flag. The optimizer chose a plan using statistics that suggested one cardinality, then encountered another. Causes include stale statistics, correlated columns, skewed tenant data, or parameter-sensitive plans. Updating statistics can fix a bad plan without changing SQL; adding an index to mask bad estimates can create unnecessary write cost.
The Most Common Root Causes
Missing or unusable indexes
A sequential scan is not automatically wrong. It is often optimal when a query needs a large part of a small table. It is suspicious when a selective lookup on a large table scans millions of rows. Check the predicate, join keys, sort order, and existing index prefixes before adding anything.
An existing index can be unusable when the query wraps its key in a function or implicit conversion:
-- Often prevents ordinary use of an index on created_at
WHERE DATE(created_at) = DATE '2026-09-05'

-- Lets the engine use a range on created_at
WHERE created_at >= TIMESTAMP '2026-09-05 00:00:00'
  AND created_at < TIMESTAMP '2026-09-06 00:00:00'
This property is often called sargability: write predicates so the engine can search an index rather than transform every stored value.
Join explosion
A nested-loop join is efficient when the outer input is small and the inner lookup is indexed. It becomes disastrous when a large outer input triggers another broad scan for every row. Look at loops, join conditions, and rows produced at each child. Missing join indexes, incorrect join predicates, and accidentally duplicated relationships can multiply work before the final filter removes it.
Too much data and unnecessary sorting
SELECT *, missing pagination, broad date ranges, and sorting a large intermediate set all move more bytes than the endpoint needs. Return the required columns, apply the most selective filters early in the access path, and use keyset pagination for deep scrolling when it fits the product. Do not introduce a cache until you understand whether the same expensive result is actually reused.
Locks, long transactions, and resource pressure
If elapsed time is high but CPU is low, inspect waits. A transaction waiting on a row lock needs the blocking transaction shortened, ordered consistently, retried appropriately, or investigated for an incident. A query that spills a sort or hash to disk needs a plan change, a smaller working set, or carefully evaluated memory capacity. Treat capacity symptoms and query defects separately; scaling a server can hide waste without fixing it.
Fix One Cause and Prove It
Make the smallest plausible change, then compare it with the exact baseline. For example, after verifying the endpoint’s access pattern, create a candidate index using your engine’s safe deployment procedure:
-- PostgreSQL example; run outside a transaction block.
CREATE INDEX CONCURRENTLY idx_orders_tenant_status_created
  ON orders (tenant_id, status, created_at DESC);
Then run the same query shape and parameters. A successful outcome is not merely “the plan says Index Scan.” Verify that p95 latency, rows scanned, buffer reads, and write impact improve under representative load. Also verify that a different tenant or status does not now regress because a plan was tuned to one narrow case.
flowchart TD
    A[Baseline: query, plan, rows, p95] --> B[State one hypothesis]
    B --> C[Apply one reversible change]
    C --> D[Re-run representative workload]
    D --> E{Measured improvement without new regression?}
    E -->|Yes| F[Document and monitor]
    E -->|No| G[Revert and test the next hypothesis]
Keep a short decision record: the statement fingerprint, affected endpoint, measured baseline, selected change, expected write cost, rollout owner, and rollback action. It prevents a useful index from being dropped later as “unused” and makes future regressions easier to compare.
Production Guardrails
Performance tuning can create outages if a large index build exhausts disk, replica replay falls behind, or an exploratory query runs without a limit. Use these guardrails:
- Test against realistic data volume and skew, not a tiny local fixture.
- Create large indexes with the database’s documented online or concurrent method.
- Set statement and lock timeouts for exploratory work where supported.
- Monitor database CPU, I/O, buffer cache, connection waits, lock waits, replica lag, and error rate during rollout.
- Roll out one change at a time and retain a rollback path.
- Recheck the plan after schema changes, statistics refreshes, and large traffic shifts.
Query performance is an ongoing property of data distribution and workload. A plan that is correct today can become wrong after a tenant grows by 100x or a product adds a new optional filter.
Interview Questions
1. What is your process for debugging a slow SQL query?
I first identify the normalized statement, endpoint, parameters, frequency, and p95 or p99 impact. I separate waiting from active execution, then capture an actual execution plan where it is safe. I look for the expensive operation, estimate-versus-actual row mismatch, loops, scans, sorts, and joins. I make one reversible change, rerun the same representative workload, and keep it only if the measured improvement outweighs the write and operational cost.
2. Why is EXPLAIN ANALYZE more useful than EXPLAIN alone?
EXPLAIN shows the optimizer’s intended plan based on estimates. EXPLAIN ANALYZE executes the query and reports actual rows and timing, which exposes bad cardinality estimates and unexpectedly expensive operators. Because it executes the statement, I use it carefully on production and never treat it as a harmless inspection command.
3. Is a sequential scan always a performance problem?
No. A sequential scan can be the cheapest option for a small table or a query that returns a large fraction of rows. It is a problem when a selective request scans a large relation unnecessarily. The decision comes from actual rows, buffers, and latency, not from treating any one node name as a failure.
4. How can an index exist but not be used?
The predicate may be non-sargable, the index may have the wrong leading column or sort order, statistics may estimate too many matches, the query may return most of the table, or a type conversion may prevent an efficient lookup. I inspect the real plan and query shape before adding a duplicate index.
5. How do you distinguish a slow query from lock contention?
I compare elapsed time with CPU and inspect database wait information. A query that is blocked on a lock can have high elapsed time without doing much execution work. The fix is to find and shorten or coordinate the blocking transaction; an index may improve a lock-holder’s duration but it does not directly resolve the wait.
Conclusion
The reliable answer to “why is my SQL query slow?” is evidence, not a generic index recommendation. Find the request and query fingerprint, classify waiting versus active work, inspect actual rows and operators, change one confirmed cause, and prove the result under realistic load. This approach catches missing indexes, bad joins, excessive data movement, stale statistics, lock contention, and application-level query storms without turning every table into an index collection.
References
- PostgreSQL Documentation: Using EXPLAIN
- MySQL Documentation: EXPLAIN ANALYZE
- Microsoft Learn: Troubleshoot Slow-Running Queries in SQL Server
YouTube Videos
- “Troubleshooting SQL Server Execution Plans” - Bert Wagner https://www.youtube.com/watch?v=lmQfR7wQ5ck
- “Identifying and Fixing Performance Problems Using Execution Plans” - Pragmatic Works https://www.youtube.com/watch?v=pdAaO4w9mxA