 ADevGuide
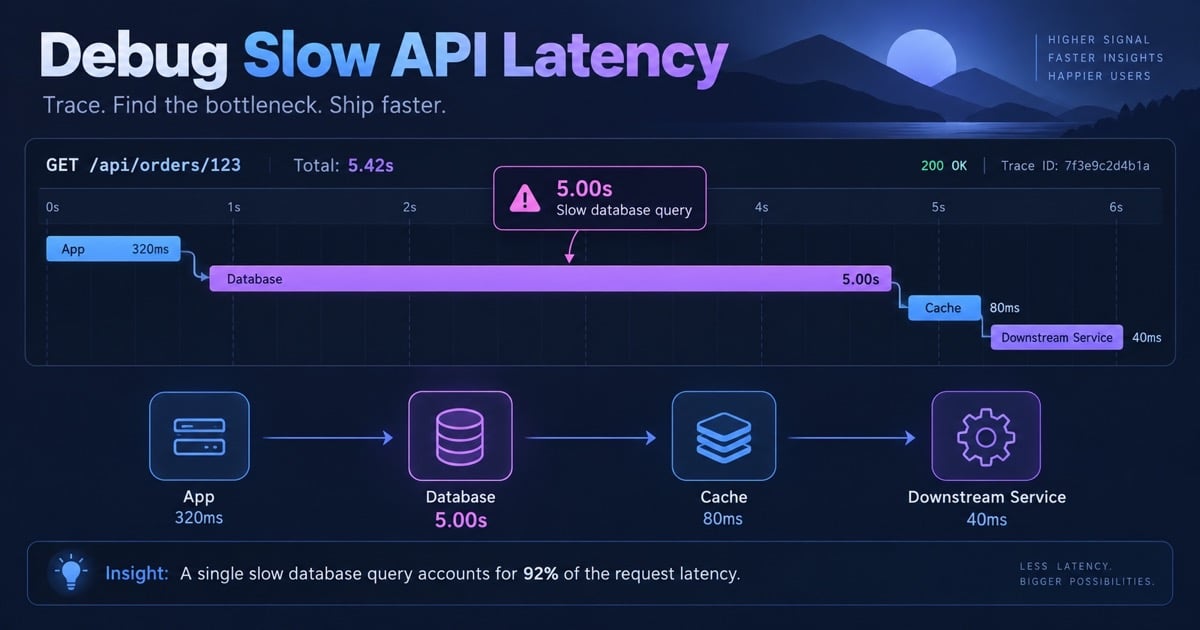
An endpoint that was 100 ms yesterday now takes five seconds. A strong interview answer narrows the fault domain before changing code. Use backend observability, distributed tracing, and timeouts as the investigation toolkit.
The Interview Question
“P95 latency for GET /orders jumps from 100 ms to 5 seconds. What do you check first, and how do you restore service safely?”
Clarifying Questions
Ask whether the change is global or one region, whether errors and traffic changed, which percentile moved, and whether a deploy or dependency incident preceded it. Assume only P95/P99 increased, traffic doubled, and no application release occurred.
The Naive Design and Why It Fails
Restarting every instance can erase evidence and amplify a database reconnect storm. Increasing timeouts makes users wait longer. Adding replicas without identifying the slow span treats symptoms and may move pressure downstream.
Better Investigation
Start with rate, errors, duration, and saturation dashboards and compare a good window. Sample traces by route and region; break the five seconds into queue, application, database, cache, and downstream spans.
flowchart TD
    A[Latency alert] --> B[Compare rate errors percentiles]
    B --> C[Trace slow requests]
    C --> D{Dominant span}
    D --> E[DB plan or pool]
    D --> F[Downstream timeout]
    D --> G[CPU GC or queue]
    E --> H[Targeted mitigation and verify]
    F --> H
    G --> H
A Layered Diagnosis
Use the request’s critical path to avoid jumping between unrelated dashboards:
- Confirm the symptom: compare p50, p95, and p99 by route, status code, region, tenant, and client. A p99 increase with a stable p50 usually means a tail dependency, queue, lock, or hot key rather than every request becoming slower.
- Check traffic and saturation: compare request rate, payload size, CPU, garbage collection, thread pools, connection pools, queue depth, and database CPU with the last healthy window.
- Trace representative requests: inspect spans for queue wait, application time, cache lookup, database execution, and downstream calls. Sample both a fast and slow request from the same cohort.
- Test the leading hypothesis: explain a changed database plan, query a dependency from a controlled probe, inspect cache hit ratio, or compare pool wait time with active work. Do not make five changes at once.
- Mitigate and verify: shed optional work, cap concurrency, disable a feature flag, or roll back a proven regression. Watch the same percentile and cohort that raised the alert.
The absence of an application deploy does not rule out change. A dependency can alter its plan, a cache can evict a hot working set, traffic can become skewed, a certificate or DNS path can change, or a background job can consume the same pool.
Turn Five Seconds Into a Budget
Suppose the endpoint’s target is 200 ms at p95, but slow requests take five seconds. If tracing shows 3.8 seconds waiting for a database connection, adding application replicas may increase the number of competing connections without fixing the database. If the database span is 40 ms but a downstream call consumes 4.5 seconds, enforce a deadline and isolate that dependency instead.
Model the request as queue wait plus service time plus downstream time:
total latency = queue wait + application work + database time + dependency time + response writeInstrument each term with the same trace ID. A timeout should cover the remaining budget, not reset at every hop. Retries consume the same budget and must be counted separately from original traffic so a retry storm cannot masquerade as demand.
Safe Mitigation by Root Cause
| Evidence | First mitigation | Follow-up fix |
|---|---|---|
| Connection-pool wait dominates | Bound callers and reject excess work | Set a global pool budget and fix leaks. |
| Database plan or lock changed | Disable the query path or cancel one confirmed runaway | Add plan regression checks and tune schema/query. |
| Downstream tail latency dominates | Open a circuit and return a valid fallback | Define dependency budgets and bulkheads. |
| Cache hit ratio collapsed | Coalesce misses and warm keys gradually | Fix invalidation, TTL, and key distribution. |
| GC or CPU saturation dominates | Shed optional work and cap concurrency | Profile allocation and load-test the tail. |
Preserve evidence before restarting instances. A restart can temporarily reduce queue depth while erasing thread dumps, active queries, and the timing relationship needed to prevent recurrence.
Failure Isolation and Recovery
If a database plan regressed, kill or fix the query and add an index after checking write cost. If a downstream dependency is slow, enforce a deadline, circuit breaker, and fallback. If the connection pool is exhausted, inspect wait time and leaks before raising pool size. Roll back only after capturing evidence.
Scaling and Trade-offs
At 2x traffic, cache hot reads, paginate, and protect the database with a bounded pool and queue. A timeout reduces tail latency but may create retries; pair it with a retry budget and idempotency. The goal is restored user-visible SLO, not a green average hiding a broken P99.
Interview Follow-Ups
1. Why look at percentiles instead of averages?
Averages hide users waiting behind a saturated queue or slow dependency. P95/P99 show tail behavior and are closer to user experience. Segment by endpoint, region, and status code.
2. How can a cache make latency worse?
A stampede can send every miss to the database, and oversized values increase serialization and network time. Compare hit ratio, key size, eviction, and backend load before tuning TTL. Request coalescing often helps more than adding capacity.
3. What does a trace prove?
It shows where sampled requests spent time and how context flowed across services. Sampling can miss rare paths, so combine traces with histograms and exemplars. A missing span is an instrumentation gap, not proof that work was fast.
4. When do you roll back?
Roll back a recent change when correlated metrics and a safe rollback exist, but do not roll back blindly for an external incident. Preserve logs and compare the rollback result. Mitigate first if rollback would increase data risk.
5. What prevents recurrence?
Add a latency SLO, dependency budgets, query-plan regression checks, pool metrics, and a runbook. Load-test the tail under realistic concurrency. Alert on saturation before the user-facing SLO is breached.
Related Practice
Continue with circuit breakers, retry budgets, and database CPU investigations.
References
YouTube Videos
- “How to Debug a Slow API” - Hussein Nasser [https://www.youtube.com/watch?v=Qg4aPDZFbkA]