 ADevGuide
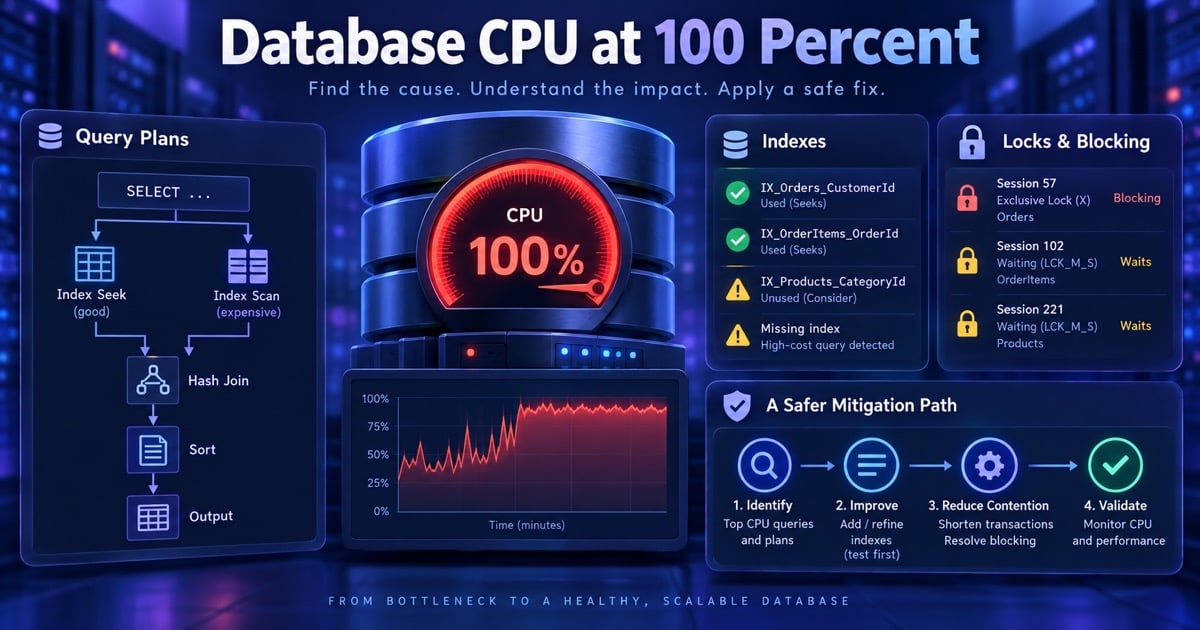
Database CPU at 100% is a symptom, not a diagnosis. The interview tests whether you protect the database while identifying the workload that changed. Pair this scenario with debugging slow SQL, composite indexes, and replication.
The Interview Question
“Production database CPU reaches 100%, API latency rises, and connections are waiting. How do you investigate and stabilize the system?”
Clarifying Questions
Ask whether reads or writes dominate, which node is saturated, when the slope changed, and whether a deploy or traffic pattern changed. Assume one primary at 100%, replicas at 40%, and a new reporting query deployed today.
The Naive Design and Why It Fails
Blindly adding indexes can slow every write and consume storage. Increasing the connection pool creates more runnable queries and worsens CPU. Killing arbitrary sessions can abort important transactions and leave partial work.
Better Investigation
Capture top queries by total and average CPU, execution count, plan hash, rows examined, locks, and temp spills. Compare the current plan with a known-good plan and throttle or disable the offending feature behind a flag. Route safe reads to replicas while protecting replication lag.
flowchart TD
    A[CPU saturation alert] --> B[Protect primary]
    B --> C[Inspect top queries and plan changes]
    C --> D{Workload cause}
    D --> E[Bad plan or missing index]
    D --> F[Traffic or connection storm]
    D --> G[Lock or maintenance task]
    E --> H[Mitigate verify optimize]
    F --> H
    G --> H
Triage, Database Safety, and Failure Handling
A Safe Triage Order
Separate containment from diagnosis so the database has enough capacity for the investigation:
- Confirm scope: identify the saturated node, workload, tenant, region, and start time. Compare CPU with I/O, memory, lock waits, replication lag, and connection usage.
- Protect essential traffic: pause the new report, reduce expensive polling, reject unbounded exports, and route only explicitly safe reads to replicas. Do not move writes or payment decisions to a stale replica.
- Find the workload: rank normalized queries by total CPU, CPU per call, calls per second, rows examined, and temp-file usage. A query used once per hour may have a large total cost, while a small query called 50,000 times per second can be the real incident.
- Compare plans: inspect the current plan, statistics age, parameter values, and plan hash against a healthy baseline. Capture evidence before creating an index or killing a session.
- Apply a reversible mitigation: disable a feature flag, add a bounded statement timeout, cancel one confirmed runaway query, or temporarily reduce traffic. Verify CPU and user latency after each change.
For PostgreSQL, a bounded investigation might use pg_stat_activity, pg_stat_statements, and EXPLAIN (ANALYZE, BUFFERS) on a representative query. Run EXPLAIN ANALYZE carefully: it executes the statement, so use a safe transaction or a plan-only explain when the query mutates data.
Capacity and Connection Math
Suppose the primary normally handles 2,000 queries per second at 45% CPU, but a reporting endpoint now adds 600 queries per second whose average CPU cost is four times normal. The added work is roughly 2,400 normal-query equivalents, enough to saturate the primary even though traffic rose only 30%. This is why query cost and frequency must be measured together.
Connection count is not throughput. If 100 application replicas each open 50 connections, the primary may see 5,000 runnable sessions even when it can use only a few dozen CPU cores. Set a global connection budget, use a pooler where appropriate, and apply queueing at the application boundary. Raising every pool during an incident usually increases contention and worsens latency.
Remediation and Verification
An index is not automatically the fix. Check selectivity, write amplification, storage, and whether the planner can use the index for the actual predicates. For a bad plan, refresh statistics or pin a safer plan only with an expiry and a follow-up task. For a reporting workload, precompute aggregates or move it to a replica or warehouse rather than repeatedly scanning transactional tables.
Roll out the change with a canary query or one replica first. Compare execution time, buffer reads, CPU, lock waits, replication lag, and error rate before expanding. Keep the previous plan or feature flag available for rollback. Close the incident only after the workload remains healthy through its normal peak and the runbook records the owner, threshold, and alert that should fire earlier next time.
Use a statement timeout for ad hoc reads, a separate pool for reporting, and resource groups where supported. If a plan regression is caused by stale statistics, refresh them carefully. If locks are the issue, identify the blocker and coordinate a safe cancel. Take a snapshot of plans before changing indexes.
Scaling and Trade-offs
Reduce work before adding hardware: cache, precompute aggregates, paginate, and batch writes. Read replicas help only for read traffic that tolerates lag. Vertical scaling is fast but finite; sharding reduces per-node work but adds routing and cross-shard complexity.
Interview Follow-Ups
1. What is the first query you run?
Use the database’s active-query and top-consumer view to identify CPU by normalized query, user, and plan. Avoid an expensive diagnostic query on a saturated primary. Export a bounded sample and compare it with baseline.
2. How does a missing index cause CPU saturation?
The engine scans many rows for each request, consuming CPU and I/O even when the result is small. An index can reduce examined rows, but its selectivity and write cost must be measured. Verify the plan uses it.
3. Why can more connections hurt?
Each runnable query competes for CPU, memory, locks, and buffers. More concurrency can increase context switching and queue time without increasing throughput. Set a bounded pool and apply application backpressure.
4. How do you handle a long transaction?
Find its owner and age, check business impact, and cancel or terminate it with approval. Fix code that holds locks while doing network work. Monitor open transactions and lock age afterward.
5. What belongs in the post-incident action list?
Plan regression tests, query ownership, safer rollout flags, pool and lock dashboards, and capacity thresholds. Add a runbook with reversible mitigations. Review whether reporting needs a separate warehouse or replica.
Related Practice
See slow API diagnosis, observability, and database sharding.
References
YouTube Videos
- “How to Diagnose Database Performance Problems” - Hussein Nasser [https://www.youtube.com/watch?v=Qg4aPDZFbkA]